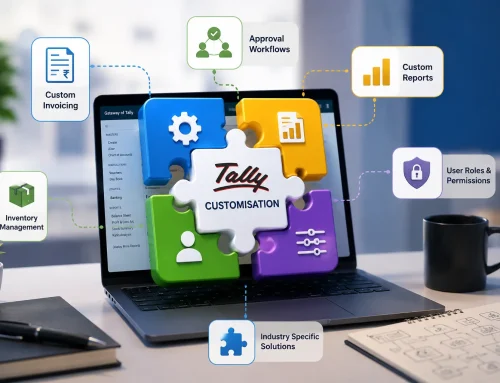
Custom TallyPrime reporting case study
The ₹2 lakh error was already in the data. The right report made it visible.
A customized TallyPrime dashboard helped a business owner identify a reporting discrepancy in about five minutes by showing sales, expenses, margins, and exceptions together instead of burying them across separate reports.
Quick Answer: How Did a Custom Tally Report Find a ₹2 Lakh Error?
A custom TallyPrime report found the ₹2 lakh discrepancy by comparing sales, expenses, expected profit, and actual profit in one decision-focused dashboard. The transactions were already recorded in Tally, but the issue stayed hidden because standard review reports did not make the relationship between revenue, expenses, and margins obvious.
The lesson is simple: accurate data is useful only when the report makes the right patterns visible.
Everything appeared normal. Sales were healthy, customers were paying, and monthly reports suggested that the business was performing well.
During a routine review, the owner opened a newly customized Tally dashboard built around key business figures: sales, purchases, outstanding payments, profit margins, and expected profit versus actual profit.
Within minutes, one trend stood out. Sales had increased, but profitability had declined. The change was not dramatic, but it was enough to investigate.
The ₹2 Lakh Error Hidden in the Reports
| What the owner saw | What the dashboard connected | What became visible |
|---|---|---|
| Sales looked healthy | Sales trend plus profit margin trend. | Revenue was rising, but margin was falling. |
| Expenses looked routine | Recurring expenses plus ledger allocation. | A small recurring allocation issue was repeating. |
| Reports looked normal separately | Sales, expenses, expected profit, and actual profit. | A pattern appeared only when the figures were reviewed together. |
| The entries were individually small | Several months of repeated posting impact. | The total discrepancy had grown close to ₹2 lakh. |
The error was not found by working through more spreadsheets. It was found because the right information was presented in the right way.
Why the Accounting Error Went Unnoticed
The business did not lack data. Invoices, expenses, payments, GST information, and inventory movement were already available. The problem was that the reporting process did not make the relationship between revenue, expenses, and profitability immediately clear.
Many expensive reporting problems start small: a duplicated voucher, incorrect ledger allocation, wrong cost centre, missed expense, inventory mismatch, or outdated management view. Individually, they may not look serious. Over time, they distort margins, cash expectations, stock decisions, and management reports.
Are your reports showing numbers, or showing what needs attention?
Review whether custom Tally dashboards can surface margin drops, expense changes, receivables delays, stock issues, and unusual patterns before they become costly.
Most Businesses Have a Financial Visibility Problem
Businesses generate useful information every day, but management often struggles to convert that information into timely answers. Important questions still require manual exports, spreadsheet consolidation, or repeated navigation across reports.
Why Standard Tally Reports May Not Be Enough
TallyPrime includes strong business reports and configurable dashboards. But every company measures performance differently. A manufacturer may need material consumption and cost-centre analysis, while a distributor may need customer profitability, stock ageing, salesperson performance, and regional sales.
Tally report customization becomes useful when management needs business-specific calculations, fields, filters, comparisons, or summary views that are not available in the required format.
What Custom Tally Reports Can Help Detect
| Report focus | What it can reveal | Why it matters |
|---|---|---|
| Profitability report | Unexpected changes in gross or net profit. | Owners can investigate margin drops earlier. |
| Expense exception report | Unusual expense patterns or wrong classifications. | Recurring small errors do not remain hidden for months. |
| Receivables report | Delayed customer collections and overdue balances. | Cash follow-up becomes more focused. |
| Inventory report | Stock discrepancies, ageing items, and excess inventory. | Cash blocked in stock becomes visible. |
| Cost-centre report | Overspending by department, branch, region, or project. | Management sees where costs are drifting. |
Want a dashboard built around your actual business questions?
Bring sales, expenses, margins, collections, stock, and cost-centre views into a report that owners can review quickly and investigate deeply when needed.
What Business Owners Should Learn from This Case
- Design reports around decisions: Management reports should answer business questions, not only compliance questions.
- Compare related figures: Revenue, expenses, margins, collections, and inventory should be reviewed together.
- Investigate persistent variances: Small repeated changes can become large reporting discrepancies.
- Reduce spreadsheet dependency: If a team repeats the same Excel work every month, a reliable Tally report may be a better answer.
- Keep drill-down available: A good dashboard should let users move from summary numbers to vouchers and transactions.
Related Guides and Services
Case StudiesTally customization case studiesSee examples of business-specific Tally workflows and reporting improvements.
VisibilityYour business is talking every dayLearn why better visibility helps owners catch signals earlier.
Customization10 signs your business needs Tally customizationKnow when repeated manual work points to a reporting or workflow gap.
Want a custom TallyPrime report that catches what standard reviews miss?
Share your current reports, Excel work, key business questions, margin concerns, and review routine. We can help identify the dashboard your management team needs first.
Final Thoughts
The business owner did not discover the ₹2 lakh discrepancy by spending more time reviewing every transaction. He found it because the report connected the figures that mattered and made an unusual pattern visible.
That is the real value of custom Tally reporting: not more data, but clearer visibility.
Custom Tally Report FAQs
What is Tally report customization?
Tally report customization means modifying or developing reports in TallyPrime to show business-specific fields, calculations, filters, comparisons, and indicators.
Can custom Tally reports identify accounting errors?
Yes. Comparative and exception-focused reports can make unusual expense movements, margin changes, allocation issues, and transaction mismatches easier to identify.
What types of Tally reports can be customized?
Sales, purchase, inventory, profitability, outstanding, cost-centre, management, GST, and operational reports can be customized based on requirements.
When does a business need a custom report?
A custom report is useful when teams repeatedly export data to Excel, combine several reports manually, or cannot quickly answer management questions.
Do custom reports replace bookkeeping controls?
No. Custom reports support bookkeeping, reconciliation, accounting review, and audit processes by improving visibility into exceptions and patterns.
Can custom dashboards include drill-down details?
Yes, where appropriate, dashboards can be designed so users can move from a summary number to underlying vouchers and transactions.